I have. Many times.
This post advocates the principle that all digital products & services should initially be set up with zero tracking.
What Is Zero-Based Tracking?
The name originates from “zero-based budgeting”, a concept about how departments should argue why they should spend any money on a given expense category at all, rather than just budgeting for an entire year at once and spending “what they’re used to”. In zero-based budgeting, “used to” is equal to 0.
The idea is to incorporate the same thing with your tracking: defining what we should track and why, instead of just installing various scripts and tracking everything (and nothing).
The main reason for doing this?
It forces you to think really hard about what metrics drive your business.
The Strategy Drives Direction
The strategy defines where we’re going. From there, we can deduct the most accurate way of measuring whether or not we are achieving the strategy.
It sounds simple. Ideally, it is.
Figure out where the company would like to go, how it will compete in the market, and where it will position itself.
Then figure out 2-3 metrics that accurately say whether or not the company is achieving that strategy.
Figuring Out Your Product Metrics
Every department in the company should have some suite of metrics that reflect how they’re doing.
From the overall company strategy, we can discuss how the product will contribute to achieving that.
Let’s imagine an ecommerce company where the person in charge of the digital product (the website) is some level of an ecommerce product manager.
The product department defines a range of leading metrics for the product.
Product Metrics Tree
One way to help figure out the leading metrics is to start creating a metrics tree. This is a great team exercise to try and define what each individual believes drives the department and ultimately, the business.

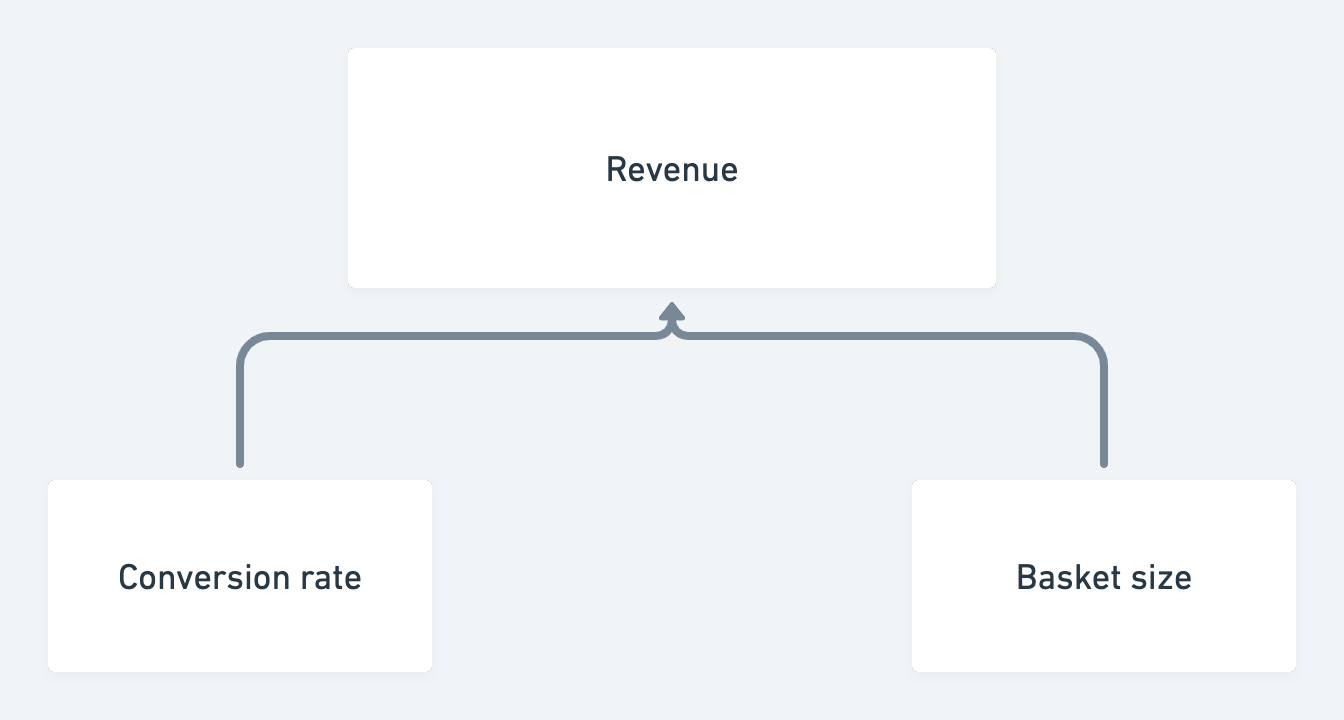
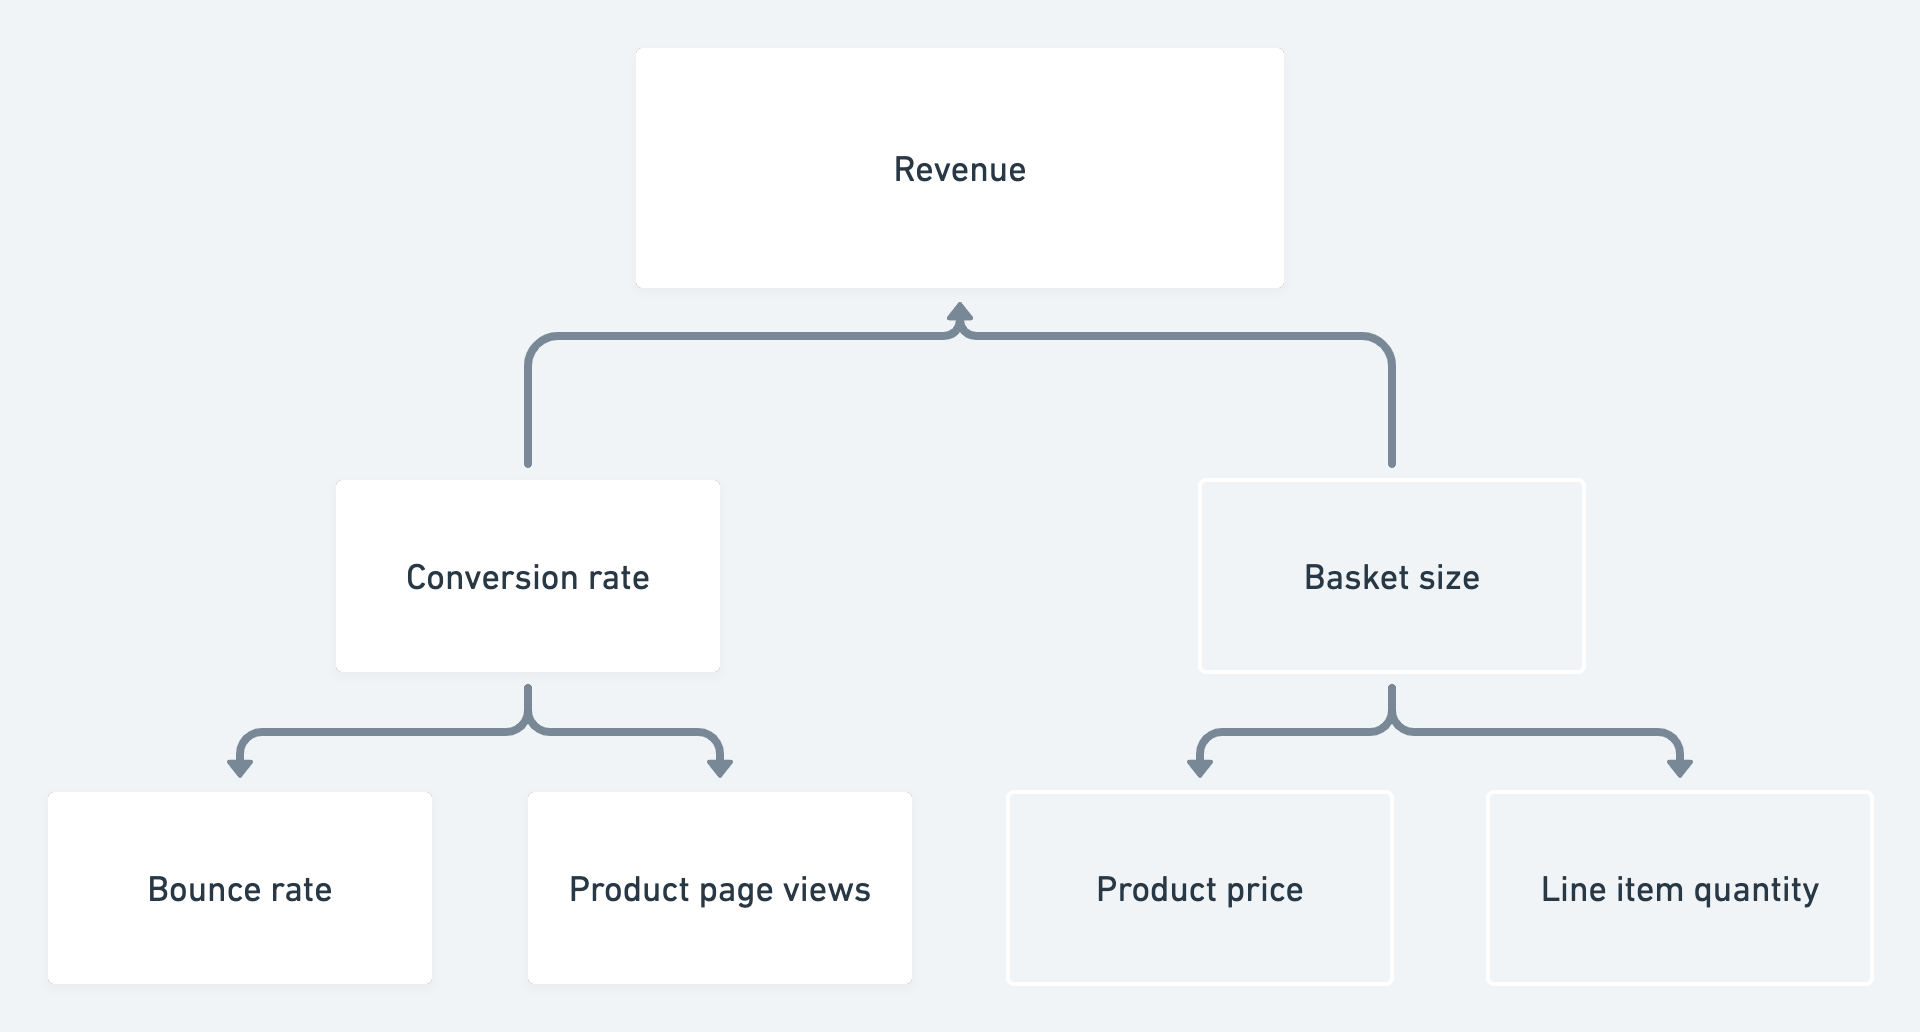
Start from the top and start adding the metrics that you believe drive each other. In my example, I’ve defined that the primary drivers of revenue are the basket size along with the conversion rate.
Now, remember, that revenue is the lagging indicator of the business. The conversion rate is the lagging indicator of the product.
The conversion rate reflects how well the product is performing at converting visitors to customers.
It’s the metric that tells us: “How well did we do?”.
Next are the leading indicators of the revenue. The place where we answer: “How well are we doing?”
“What metrics drive the conversion rate?”
For the conversion rate, I’ve defined that:
Bounce rate
Product page views
Are the primary drivers of my conversion rate. This is an extremely important decision to make, as it will serve as an argument for most future actions I will take to move the product in the right direction.

Tracking drives insights, insights drive tracking
Based on our initial tracking, we might discover insights or trends that lead us to want a new thing being tracked.
From my example above, let’s imagine that I’ve tracked the bounce rate across the different page types of the ecommerce business.
I’ve discovered that particularly the category pages have an extremely high bounce rate.
From here, I do two things:
I set up a small group of user tests with participants from our target customer audience
I set up Hotjar to track screen recordings of people who visited one of the category pages but never visited a product page (the micro-conversion)
This lets me observe how users interact with the category page, it lets me know what they’re thinking, what facial expressions they’re making, and listen to potential friction they’re encountering.
The screen recordings enables me to spot trending obstacles, poor UX, and other things that I otherwise would never have noticed.
From “Push Tracking” To “Pull Insights”
By starting your product growth endeavors like this, you’re moving from a state where tracking is pushed to the business users, to a place where business users will ask for the insights they need.
… and it will be very clear why they need them.
When Should You Start All Over?
Google Analytics, the most used analytical tool for non-SaaS businesses, is shutting down its current version at the beginning of 2023.
This makes it the perfect time to reconsider your current tracking setup.
Do you really need all the things that you’re currently tracking? Should you start over now?
